

The state of waterbody mapping in OpenStreetMap
In my look at the OpenStreetMap coastline data quality i demonstrated the varying detail and accuracy of the data. But as i pointed out the coastline is structurally simple and the way it is processed in Openstreetmap ensures a formal consistency at least. Here i will have a look at the situation with respect to the inland water bodies.
Various types of waterbodies have been routinely mapped in Openstreetmap since the beginning. There are currently the following established ways to tag inland waterbodies:
- Areas with natural=water are commonly used for all kinds of water surfaces. water=* can be used to specify in more detail what type of water surface - lake, river, canal etc.
- Natural linear water features are tagged waterway=river|stream. The order of nodes is supposed to be in flowing direction.
- Artificial linear water features are tagged waterway=canal|drain|ditch. If water is flowing the order of nodes is supposed to be in flowing direction.
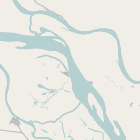
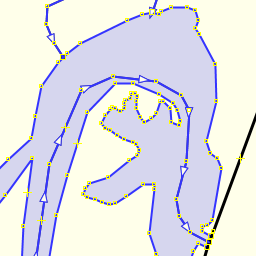
- Broader linear water features have historically been mapped with closed ways tagged as waterway=riverbank. This tag is still widely used for both simple areas and multipolygons. There should always be a centerline tagged waterway=river or similar in such areas.
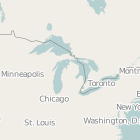
- Some very large lakes are tagged natural=coastline.
- Waterbodies that regularly fall dry can be tagged intermittent=yes or water=intermittent.
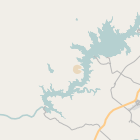
- Artificial lakes and reservoirs have historically been tagged landuse=reservoir.
|
|
|
|
|
|
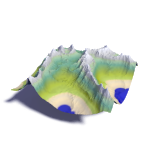
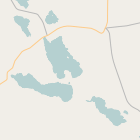
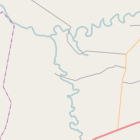
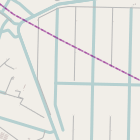
| water area example | river line example | canal example | riverbank example | coastline lake | reservoir example |
As can be seen there are various options - in the normal slippy map all these taggings are rendered in the same blue color. There is no way to determine from the map alone what kind of tags are used or what kind of feature a certain blue area represents.
Here are a few number from taginfo on how frequently these taggings are actually used:
| Tag | Features | Notes |
|---|---|---|
| natural=water | 4 820 039 | |
| water=* | 321 360 | |
| water=lake;pond | 58 059 | at least 57 252 of these are from NHD import |
| water=lake | 19 680 | |
| water=pond | 17 956 | |
| water=reservoir | 10 608 | |
| water=river | 3 822 | |
| water=canal | 1 517 | |
| waterway=* | 8 608 656 | |
| waterway=stream | 6 742 984 | at least 1 251 277 of these are from NHD import, ~2 300 000 from CanVec import |
| waterway=river | 624 282 | |
| waterway=ditch | 376 597 | |
| waterway=drain | 229 136 | |
| waterway=canal | 156 891 | |
| waterway=riverbank | 257 409 | |
| intermittent=yes | 688 058 | at least 634 627 of these are from NHD import |
| water=intermittent | 196 756 | |
| landuse=reservoir | 267 230 |
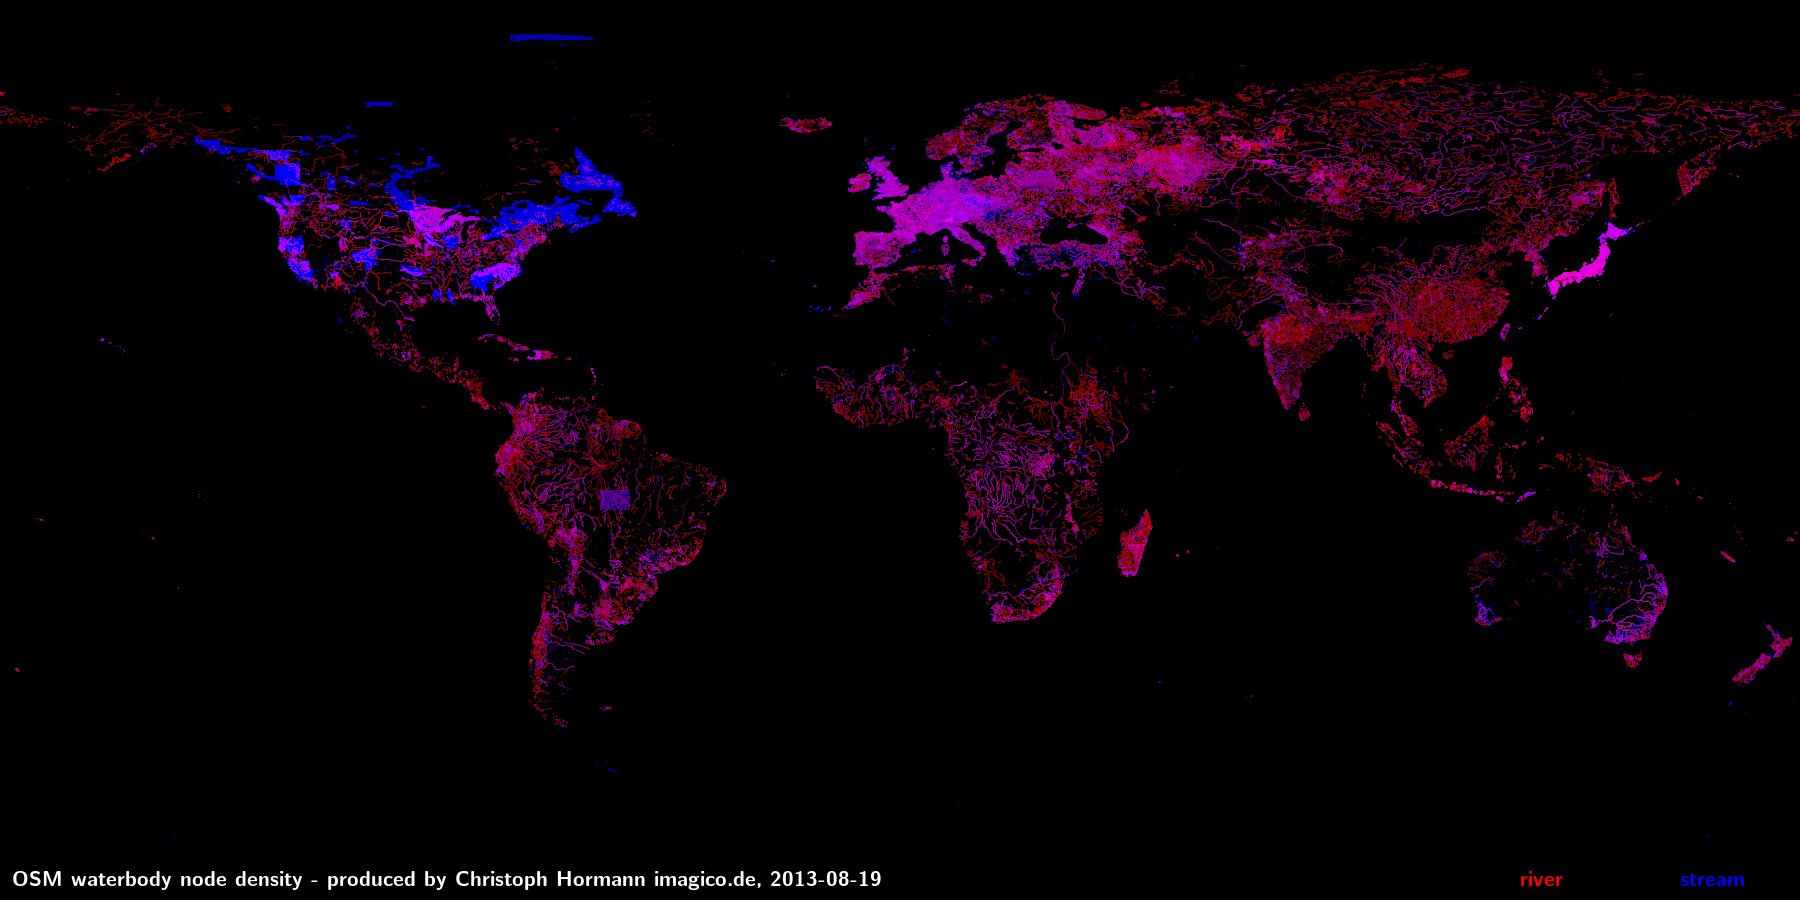
The spatial distribution of these these features can be seen in the following images. This maps show the node density of features with the above mentioned tags. In the first image red is used to indicate area features (i.e. natural=water, waterway=riverbank and landuse=reservoir) while blue indicates line features (i.e. waterway=*).
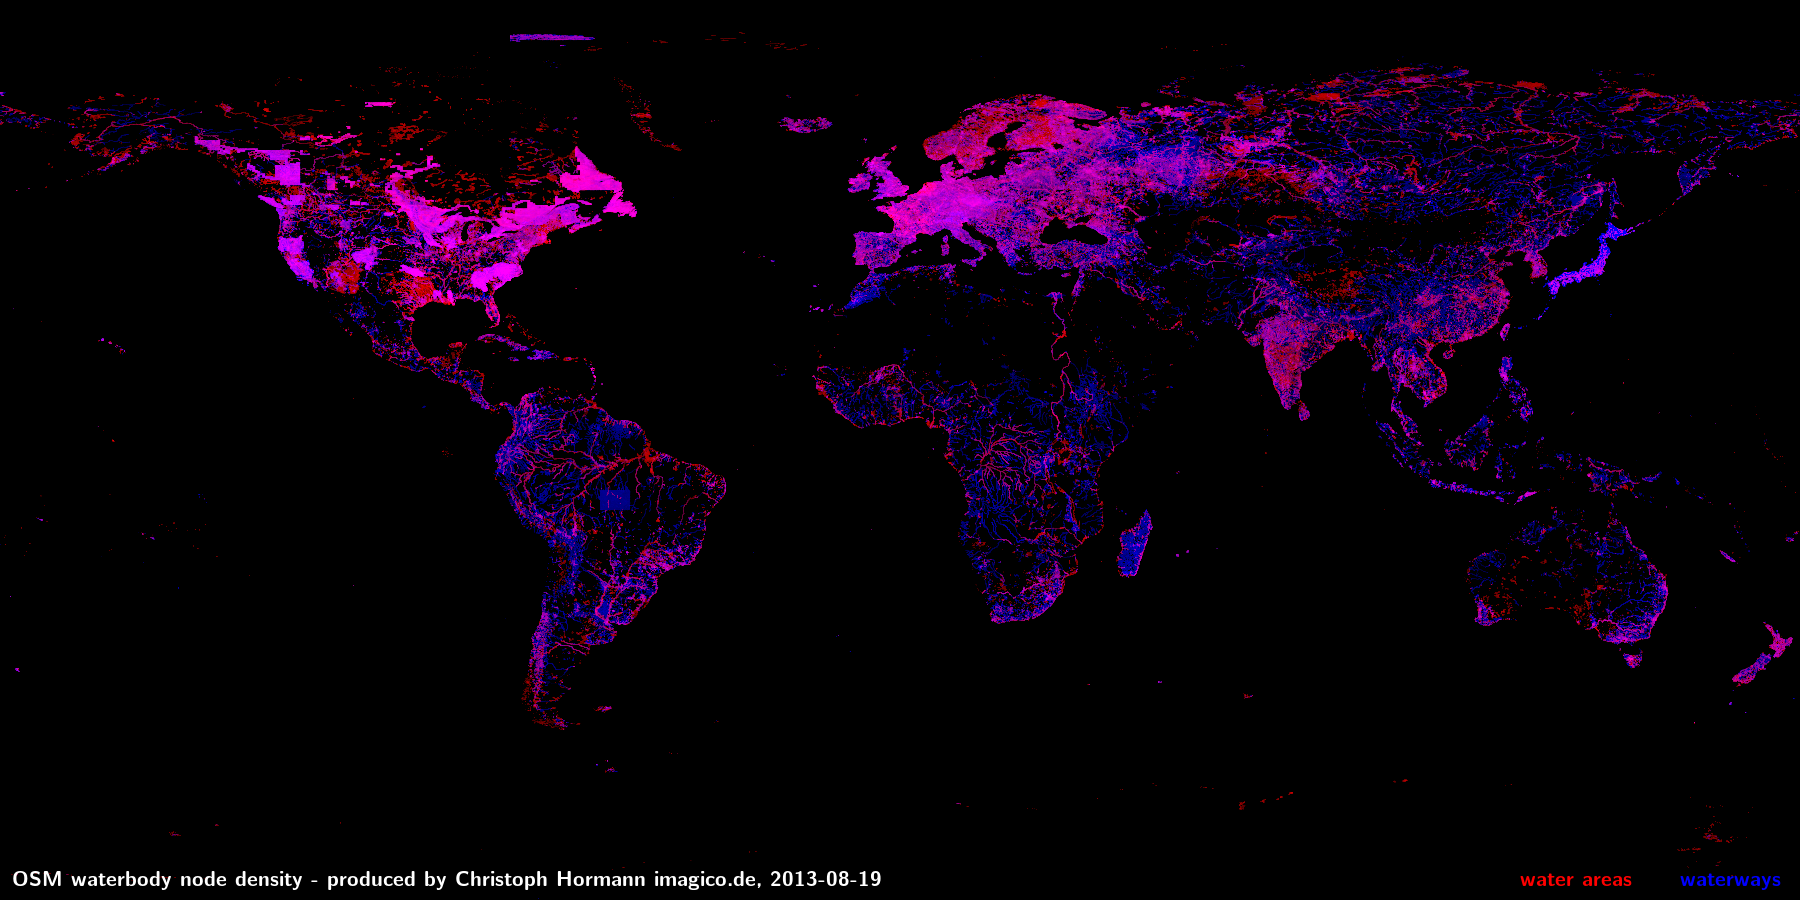
Now waterbodies are of course not evenly distributed on earth – their incidence among other things depends on climate, relief and geology. This makes it difficult to conclude from a density map like above on the completeness of the data.
What can none the less be seen is that Central Europe and parts of North America are densely mapped with both area and line features resulting in bright magenta coloring. The relatively higher incidence of line features in Japan could be due to the mountainous geography. Similarly the more reddish appearance of Northern Europe is probably due to the high incidence of lakes in that region. Dry regions tend to have fewer lakes than more humid areas. What can be seen as well is that coverage in North America is somewhat patchy with areas of high feature density sharply separated from low density areas by straight lines. This indicates partial imports of data from external sources. There are only few areas outside North America with straight line import boundaries clearly visible in this map: An area in central Brazil with line features imported from IBGE data and an area in Siberia at the lower Yenisei river with water area mapping apparently based on satellite images.
The second map below shows waterway=river (red) in comparison to waterway=stream (blue):
This very well shows the areas in North America were data from other sources has been imported which show up in deep blue. With normal mapping densities of river and stream features are correlated – a high stream density will not occur without also larger rivers being mapped. The deep blue areas indicate waterways have been imported and tagged waterway=stream across the board including larger ones which should be tagged waterway=river.
The rarity of waterbodies in desert regions is to be expected and can obviously not be attributed to non-uniform mapping. There are other differences visible in the map that clearly indicate different levels of completeness in mapping though. The actual abundance of waterbodies in Siberia, northern Canada and Alaska is quite similar to Northern Europe for example - still these regions are much less densely covered with waterbody features in OSM. Similarly tropical regions are fairly sparsely covered as well.
There are two trends that can be observed when moving away from densely mapped areas:
- With decreasing attention to detail during mapping rivers often tend to be just mapped as centerline rather than with riverbanks. This trend can for example be observed in the first map in the European part of Russia where outside urban areas a blue tone dominates. But natural differences in incidence of larger waterbodies have a strong influence here as well – you can for example widely see that flat coastal areas often have a more reddish tone.
- Getting even further away from civilisation small rivers tend to be neglected in mapping leaving only the larger ones which are mapped as areas. This results in the coarse red networks of lines widely visible in the map. This phenomenon can especially be observed in forested regions and where mapping is widely done based on satellite images. Smaller rivers are often not well visible in those cases leaving only larger water areas to the mapper.
Inconsistencies and errors
So far i have looked at how much data there is in different parts of the world. This does not say anything about the quality of the data though. There is not much that can be said about the accuracy of the mapping without actually knowing how the features look like in reality but we can look at how consistent the data is.
First some general observations on how the tagging conventions described at the beginning are handled in actual mapping:
- Specifications of water area types water=* often do not exist. There are 4.8 million features tagged natural=water but only about 100000 of those have a water=* tag specifying the type (not counting water=intermittent and similar here).
- The historical taggings of riverbanks and reservoirs are still widespread and mixed with the new one in various ways making correct interpretation difficult.
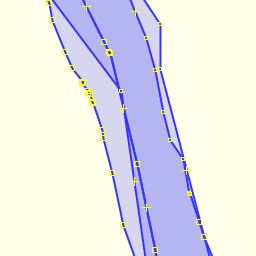
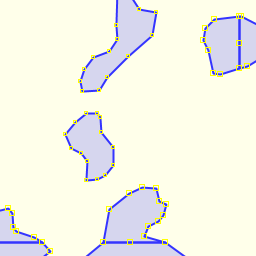
- Water areas are frequently split arbitrarily. Overlaps can of ten be found as well.
The overlaps and the varying tagging of riverbanks can be overcome with some effort by careful processing. But overall these issues make it mostly impossible to differentiate between different types of water areas when interpreting the data. This is a huge problem when you need to distinguish between stationary and flowing water or between natural and artificial waterbodies. Apart from that:
- Centerlines are often not connected, especially smaller tributaries of larger rivers often end at the riverbank. Lakes in the course of rivers also often interrupt the centerline. As a result interpreting the linear water features alone is usually not possible.
- intermittent=yes is rarely specified, even for lakes which are dry most of the time. In fact in not imported data water=intermittent is much more widely used although this would collide with any type specification in case of water areas.
- River lines are not always oriented in direction of the water flow.
- Apart from these issues specific to waterbodies the more general problem of broken multipolygon relations is very common in case of water areas. After administrative boundaries waterbodies are probably the most affected type of feature for this.
Here some examples of the problems illustrated by JOSM screenshots:
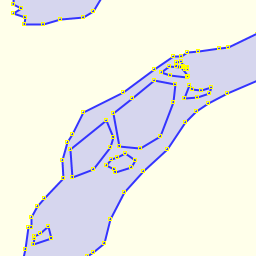
|
|
|
| inner rings tagged waterway=riverbank | overlapping areas | arbitrary area splits |
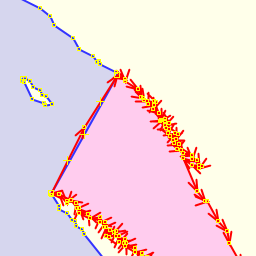
|
|
|
| waterways not connected | overlapping areas | arbitrary area splits |
Tagging issues
The lack of differenciation between different types of water surface is further encouraged by the tagging - use of natural=water alone is sufficient for the renderer and any other tags are not visible in the rendered map. The old technique to use waterway=riverbank was somewhat better in this regard ensuring at least a distinction between flowing and standing water. In case of the line features there is the established distinction between river and stream which is widely used in the actual data and which is also interpreted by the renderer (streams are rendered as thinner lines and only at higher zoom levels). There are two problems with this distinction however:
- Rivers and streams only represent two classes while the size of a waterway (however it is defined) is a continuous quantity. For many practical purposes the threshold between those two classes is fairly low and river is a very broad classification.
- The distinction between river and stream is supposed to be made based on width (if you can jump across it it's a stream). Although this is probably a very usable criterion for central Europe and regions with similar climate is fails in other parts of the world, especially dry regions. An intermittent river always fulfills the stream criterion at least for parts of the year and as a result there are rivers of significant size, sometimes more than 50km in length which are tagged as stream. This does not mean the river/stream distiction does not contain useful information but for the purpose of map rendering it is of limited use.
There is currently no established tagging to relate a river or canal water area to its center line. This essentially makes it impossible to conclude from the type of a centerline on the type of the water area in case the latter is not tagged. You might for example assume a water area intersected by a way with waterway=canal is a canal but in case for example of a canal connecting two lakes the centerline will intersect the lake areas as well although these are no canals.
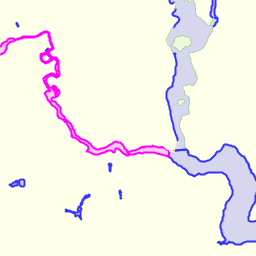
Waterway relations
Relations with type=waterway have been introduced to structure the waterway data in Openstreetmap. A waterway relation is supposed to represent a river – in the meaning of a linear watercourse with a certain name. The connectivity between the rivers may be stored in the relation by using the tag destination. This is supposed to be the name of the destination however which is often not unique and therefore difficult to interpret. Also it is difficult and error prone to handle for the mapper, especially when in a foreign language and as a result it is rarely used. Some waterway relation therefore have the corresponding waterway relations of their tributaries as members with role=tributary producing a hierarchy of relations. This is difficult to maintain though with current editors. In total there are currently about 8000 waterway relations in the database, most of them in Europe as can be seen on the following density map.
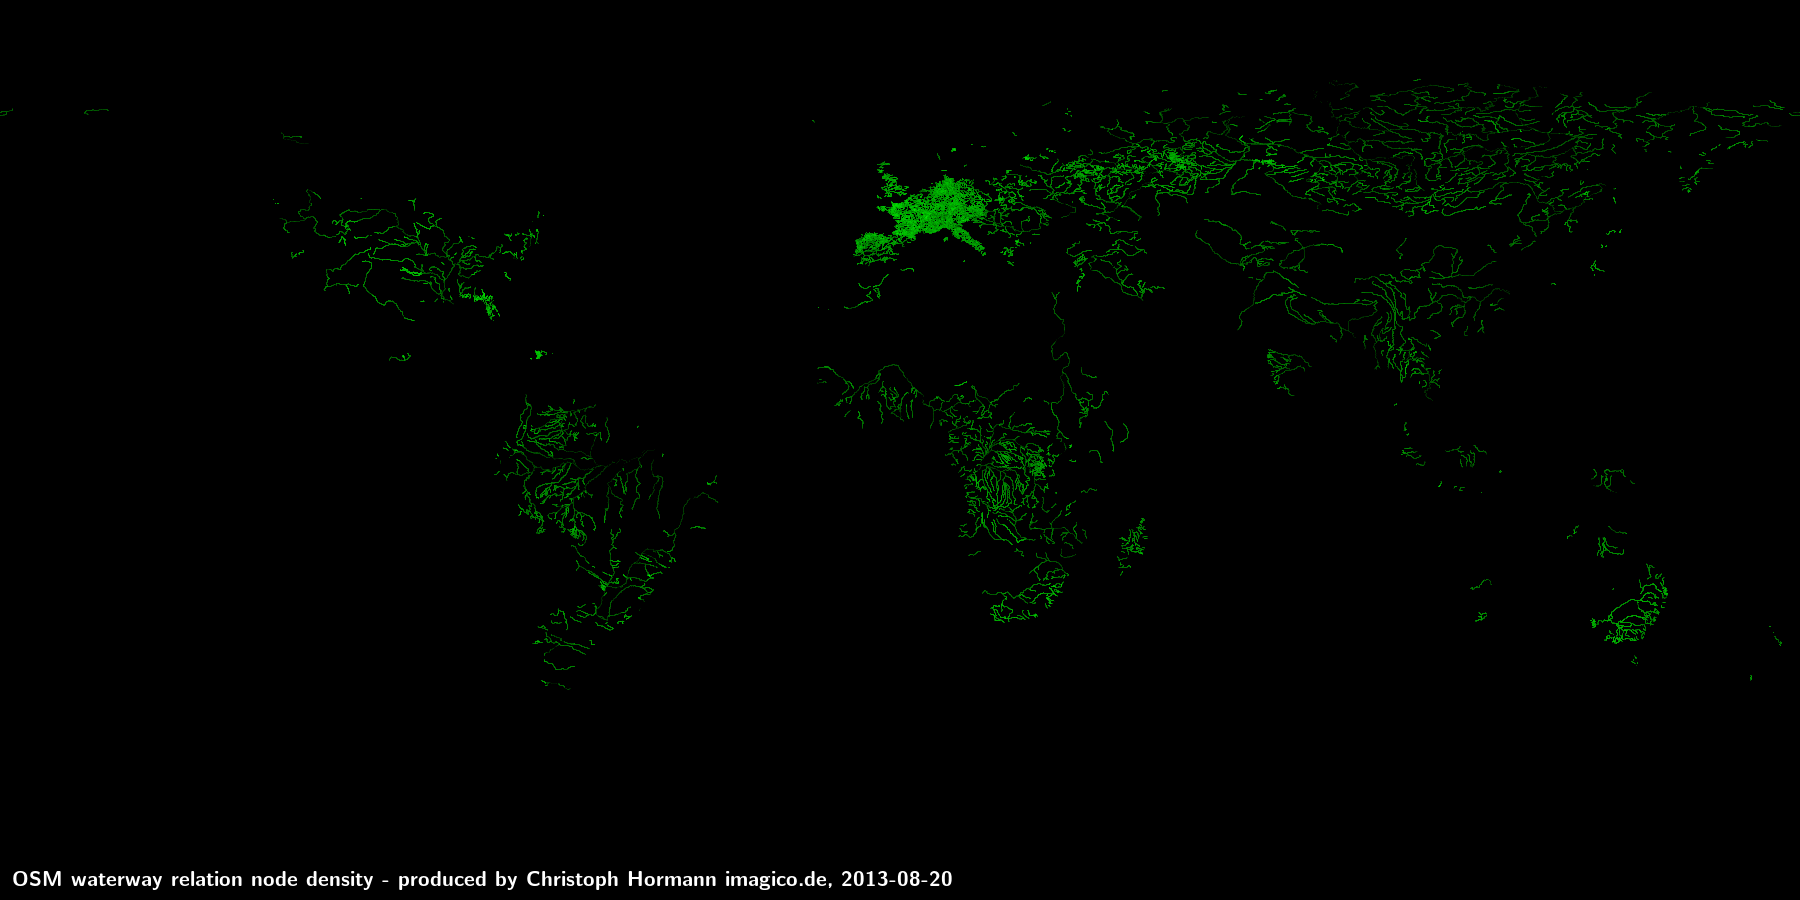
Christoph Hormann, August 2013

Visitor comments:
no comments yet.
By submitting your comment you agree to the privacy policy and agree to the information you provide (except for the email address) to be published on this website.