

Mapping and map rendering of human settlements in OpenStreetMap
Human settlements are one of the primary features that are recorded in OpenStreetMap. The most frequently mapped type of object in OSM are buildings, there are more than 110 million of them in the database. The widespread recording of buildings and their importance in everyday life makes them a nice example to explain the mapping practice in OSM and the problems resulting from it. I here want to have a critical look at the different levels on which human settlements are mapped in OpenStreetMap, how this data is used to render maps, what limitations this results in and what can be done about it.
There are several levels on which human settlements are recorded in OSM above the building level:
- Named settlements of any size are mapped as nodes tagged place=city|town|village|.... Many maps use these to show settlements as dots even though the standard OSM map style does not. Still these nodes are used to place labels of settlements there. They are considered the primary data objects for the settlement as a whole.
- Many larger settlements form an administrative unit that is mapped as an area with boundary=administrative. This is however not a mapping of the settlement but of the administrative boundaries which exist independent of the actual settlement.
- Urban landuse mappings like landuse=residential|commercial|industrial|...
|

|
|
| Node based labels in standard style | Dot markers in humanitarian style | Administrative boundaries |
The interesting point here is the landuse mapping. I often use urban land use as an example that OSM mapping practice includes different levels of generalization of the same real life objects in parallel and thereby in fact violates central OSM rules.
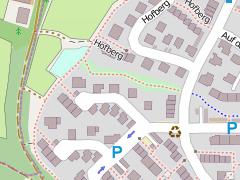
If we take for example landuse=residential. Common practice in OSM for mapping residential areas is to draw such a landuse polygon around the residential buildings. This usually includes the ground around the buildings that is owned and managed together with those and commonly consists of gardens, driveways, parking lots, walls, hedges etc. - everything around the buildings and usually also covers the smaller residential roads with their pavements, common areas like playgrounds, village greens and similar things. The landuse=residential does not really characterize all of these elements however, it characterizes the buildings located within it. If these are no residential buildings but offices or shops it would be a different landuse, even if everything else is the same.
|

|
|
| Example of landuse=residential (click on image to see the extent of the polygon) | landuse=commercial | landuse=industrial |
So landuse=residential and other urban land uses are in fact mapping of human settlements on a coarser generalization level than the individual buildings. The question is of course on what scale this generalization happens. If there are one or two shops inside a residential area these are usually simply included in the residential landuse. The structure of towns and cities varies and there are no documented rules here, neither on how strictly residential, industrial and other areas are separated and how closely the landuse is modeled around the corresponding buildings. But any larger road, river, park or other larger structure usually interrupts the landuse so most urban landuse polygons are limited in size to a few hundred meters. The level of generalization also depends on how detailed the mapping is in the area, if small details are recorded in other aspects the landuse will often also be recorded more fine grained.
Rendering of settlements in the map
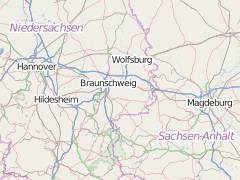
The above list of forms in which human settlements are recorded in OSM is fairly complete. And this creates a problem when producing maps from the OpenStreetMap data at different scale. At coarse scale the nodes are used to place the labels and possibly draw dots at the locations of the settlements. At high magnification the landuse polygons are drawn as well as the buildings. Both these cases can be seen in the examples above. But at intermediate scales with pixel sizes of a few hundred meters to a few kilometers there is a problem: The scale would require large towns and cities to be shown as more than mere dots since they cover larger areas of many kilometers in size, The landuse polygons however are too fine grained for this purpose, a typical city contains large areas that do not belong to any of the typical urban landuses so there are typically many gaps in the landuse coverage, green areas of various kinds, large roads, rivers etc.
 |
| urban landuse around Hannover from OSM |
What would be needed here is a stronger generalized data set for the towns and cities that covers the whole site and includes those areas inside the town that are not included in the urban landuse mapping. There are three possible ways to approach this:
- Record this data separately in the OSM database as an additional generalization level.
- Get the data somewhere else.
- Produce this data from the information in the database, i.e. the landuse polygons and the buildings.
Now option 1 would most likely be a bad idea - the existing two levels of mapping, individual buildings and landuse polygons, already cause inconsistencies when one does not match the other. The problems resulting from this will be further discussed in the following. Adding a third representation of the same thing would further extend these problems.
Option 2 is what is used in the current standard rendering style of OpenStreetMap. There is a data set of builtup areas from the VMAP0 database that contains polygons with a level of detail suited to be used at intermediate scales in OSM. This data is very old and very non-uniform however. You can see that when looking at the data in Europe for example:
 |
| VMAP0 builtup areas in Europe |
where there is very dense data in southern Russia and Ukraine but only very patchy information in southern Europe. This was already inaccurate back when the data was acquired and is even worse today. Needless to say the data does not match the information in the OpenStreetMap database.
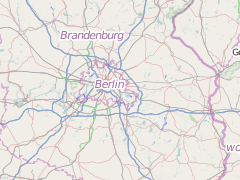
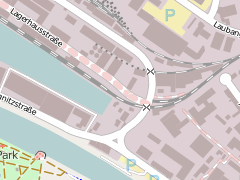
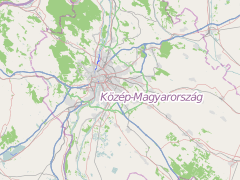
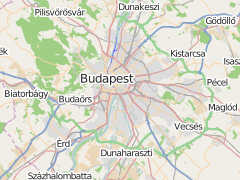
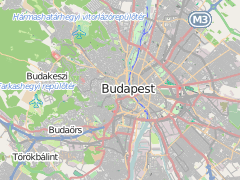
This data set is used in the OSM standard style at zoom levels 8 and 9 - you can see that in the examples below. It is drawn in light gray.
|
|
|
| zoom=8 | zoom=9 | zoom=10 |
Now newer, more accurate urban land use data sets exist, like here - but it is kind of strange that an OSM map has to use external data for something the project aims to record in detail itself.
Generalizing OSM settlement data
That leaves option 3, namely to produce such information from the data currently in the OSM database. I explained the idea of geometric generalization for the coastlines previously, namely to remove detail for the data that cannot be properly displayed at the target map scale. The logical starting point here are the landuse polygons. As you can see in the illustration above the main details that need to be removed are the gaps between the landuse areas due to roads etc. These would disturb the appearance in the rendered map and the unnecessarily fine detail would also reduce rendering performance.
The more serious problem is however that urban landuse mapping is frequently incomplete. This especially applies to downtown areas where many buildings have mixed use so neither landuse=retail nor landuse=residential fit. You can see that in the following example of Prague:
 |
| OSM landuse data of Prague (orange) and VMAP0 data (red) |
The other settlement data that is available are of course the buildings - here a plot of those in the same area:
 |
| OSM building data of Prague and VMAP0 data (red) |
Here the building data is much more accurate and complete. There are however also many regions on the planet where building data is missing.
The third possibility are the roads - this idea is pretty obvious when you look at the map at zoom level 10 like in the example of Budapest above. The dark gray color is not the urban landuse but are the roads. The road density can be an indicator for urban areas - it can however also be misleading because there are other areas with large road density, for example near complex traffic junctions, that are not necessarily close to human settlements.
The main reason for using the roads is that buildings and urban landuse are often not mapped, like in large parts of the USA and Japan. This leaves the roads as the only elements in the OSM data that can be used as an indicator for an urban area.
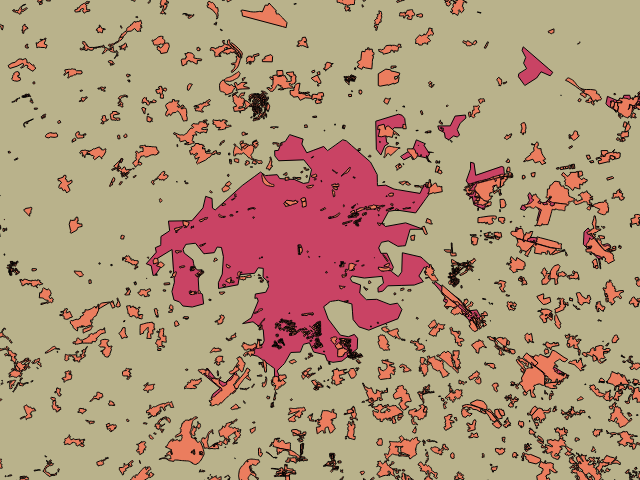
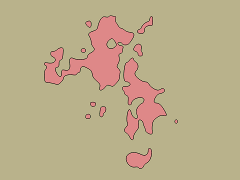
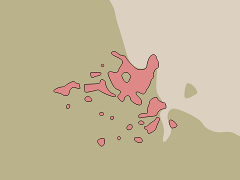
Combining urban land use, building and road data it is possible to work around the inconsistencies between these three individual data collections. Below you can see three examples from different parts of the world - Prague as a European city with detailed building and road mapping but incomplete urban landcover, Sioux City as a typical US city with buildings only mapped near the town center and otherwise only imported roads. Finally Dar es Salaam as an African city with somewhat patchy mapping and high detail only in small parts. There you can also see that the VMAP0 data lacks appropriate representation. You can click on the images to open the standard OSM map with the polygons as overlay.

|
|
|
| Prague | Sioux City | Dar es Salaam |
These three examples were processed with the same settings, ideally those would need to be adjusted for the local mapping style of course. If building and landuse mapping is fairly complete results are usually better when not using the road data.
 and urban landuse data (orange) of Prague together with the generalized urban area polygons (blue)") |
| Buildings (black) and urban landuse data (orange) of Prague together with the generalized urban area polygons (blue), click to see in larger. |
The target map scale of this processing is approximately zoom levels 8-10. As said at z=10 the roads dominate in the standard style. For map readability it could certainly be better not to show the minor roads at this scale.
The problem about using either roads or buildings is the large amount of data that needs to be processed. So processing the whole earth this way is not something you can do so easily. It should however in principle be possible to do part of this in incremental form, meaning it is not necessary to do all the processing newly from scratch every time something changes but to work in the changesets to update the data basis.
Using generalized settlement data in a map
To test how OSM data processed this way looks like in a rendered map you can download polygons in web mercator projection here. These are based on building, urban land use and road data from OpenStreetMap. When you use this it is important to draw the other, not explicitly generalized data in the map above the these polygons, in particular waterbodies.
These files are made available under the Creative Commons Attribution-ShareAlike 3.0 license. Data source is © OpenStreetMap contributors. Some might wonder why these are not licensed under ODBL like the original OSM data - this is because these polygons are a rendering of the data and it is neither intended nor possible to extract the actual building and landuse data from it. Therefore it is a produced work in terms of the ODBL.
- builtup_osm_3857.zip (25 MB) zipped shapefile with settlement polygons (updated June 2014 for full global coverage)
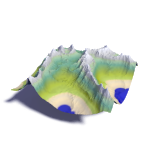
In general the need for custom adaptation of the generalization parameters is higher in case of the settlements than it is for coastlines and glaciers. Settlements usually have no clearly defined boundary and it is a matter of choice to what extend you consider fairly isolated buildings to be still part of a nearby settlement or not. Such subjective choices require changes in the parameters. Processing of OSM settlement data is available as custom production in the data products on services.imagico.de. The following map for example integrates the generalized OpenStreetMap based settlement information into the general landcover coloring - which is a bit different in the way it is processed from the polygon based generalization shown above.
 |
| Map rendering example with generalized OSM settlement data |
Christoph Hormann, April 2014

Visitor comments:
By submitting your comment you agree to the privacy policy and agree to the information you provide (except for the email address) to be published on this website.