

Spring 2014 update on the OpenStreetMap coastline data quality
After my initial analysis of the quality of the OpenStreetMap coastline data and a half year update in August i here give another update on what has changed in the OSM coastline in the last half year.
Recent changes in the Openstreetmap coastline
Like previously most updates in the coastline cover only smaller areas and are located in regions of high general mapping activity. Here is a list of somewhat larger and more unusual changes that happened since August.
- In Canada additional lakes have been retagged as natural=water
- In
 southern Alaska some parts have been improved based on USGS data of unspecified age.
 - More improvements in the Russian far east from Bing imagery.
- Some local detailed mappings in southern Chile.
- Various improvements on the Philippines.
- New mapping of the previously mostly unmapped Spratly Islands.
- Various improvements on the African coast like here.
- Retagging of the Rio de la Plata as riverbank (somewhat questionable, leading to more than 100km long coastline segments).
- New mapping of parts of Svalbard from Landsat images, see also here.
- Improvements in northmost Greenland based on Landsat.
- Completion of the mapping of Franz Josef Land as well as
Severnaya Zemlya.
The total length of the coastline is now 1.981 million kilometers (somewhat less than in August, probably mostly due to removal of coastline tagging from various water features). The average node distance is now 61 meters (was 64 in August).
The age of the coastline data
In addition to the quality analysis maps this time i also produced a visualization of the age of the coastline nodes. Note this shows the formal age of the OSM data, it does not say anything about the age of the source data it is derived from. And newer nodes take precedence meaning when only few nodes in an area have been changed recently the section is still drawn in blue.
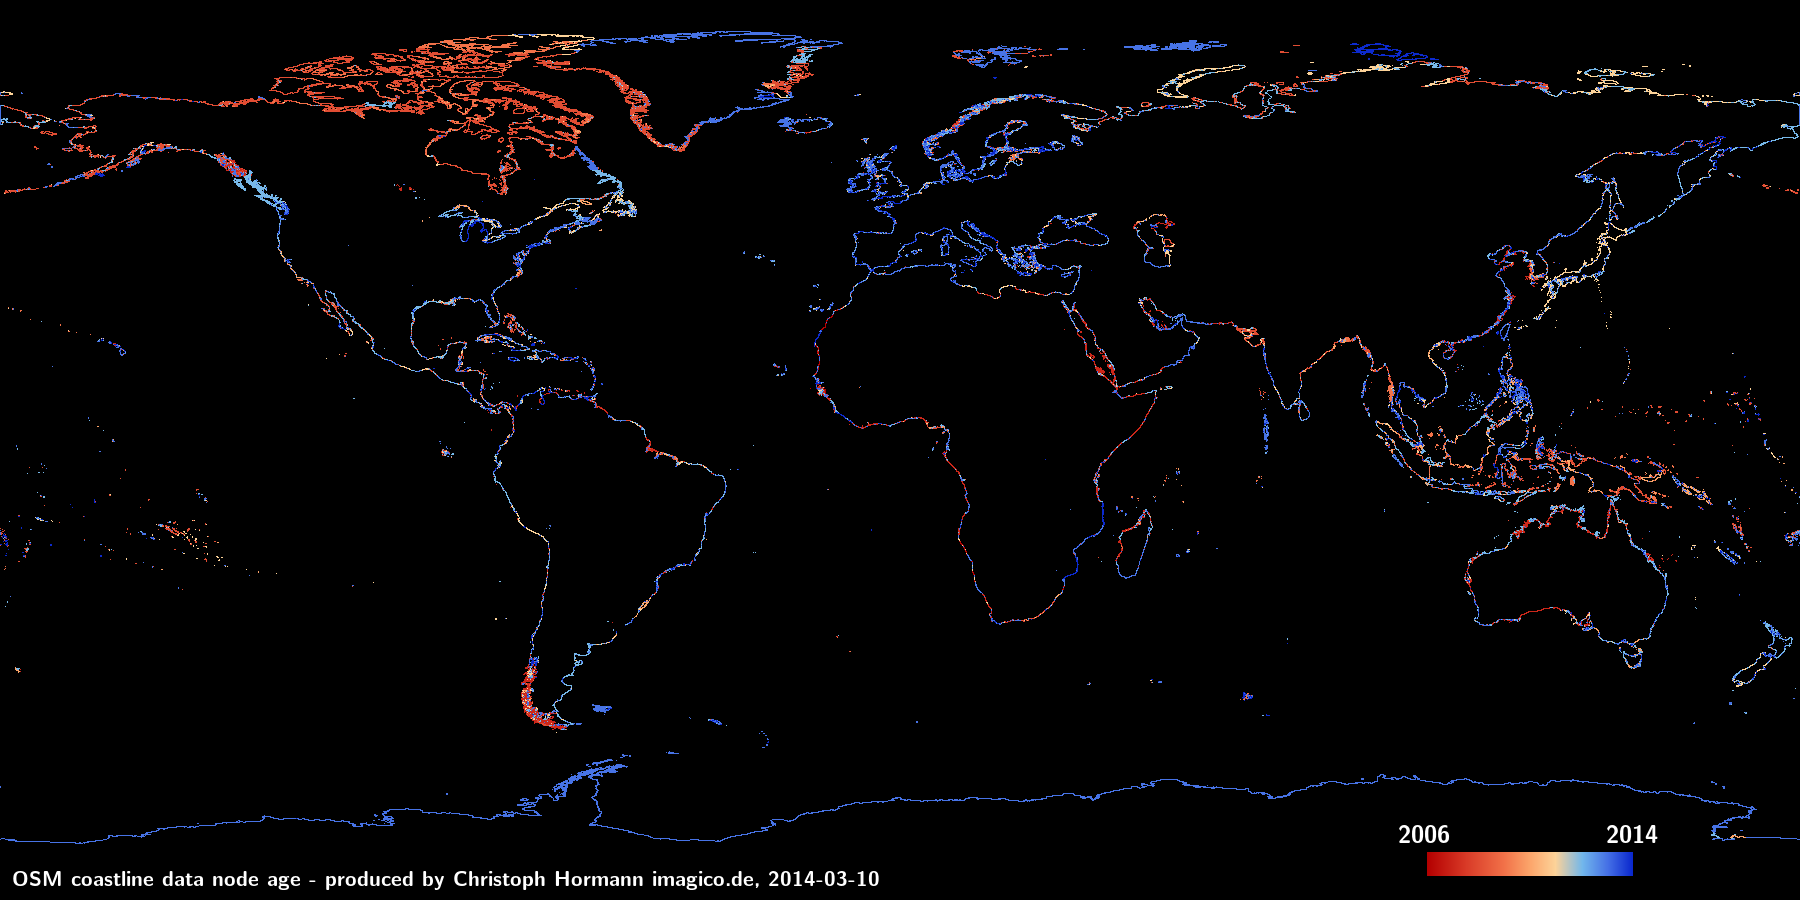
What i find most interesting is how few areas there are with intermediate node ages from 2010-2011. This is probably because the initial large scale PGS imports have happened earlier and in areas where later updates took place these updates are more or less recurring, i.e. the coastline is frequently modified. What is also visible is the huge area in northern Canada that saw hardly any modifications since the initial PGS import. In you look at the area in the map you will also see there is hardly any data there except the coastline.
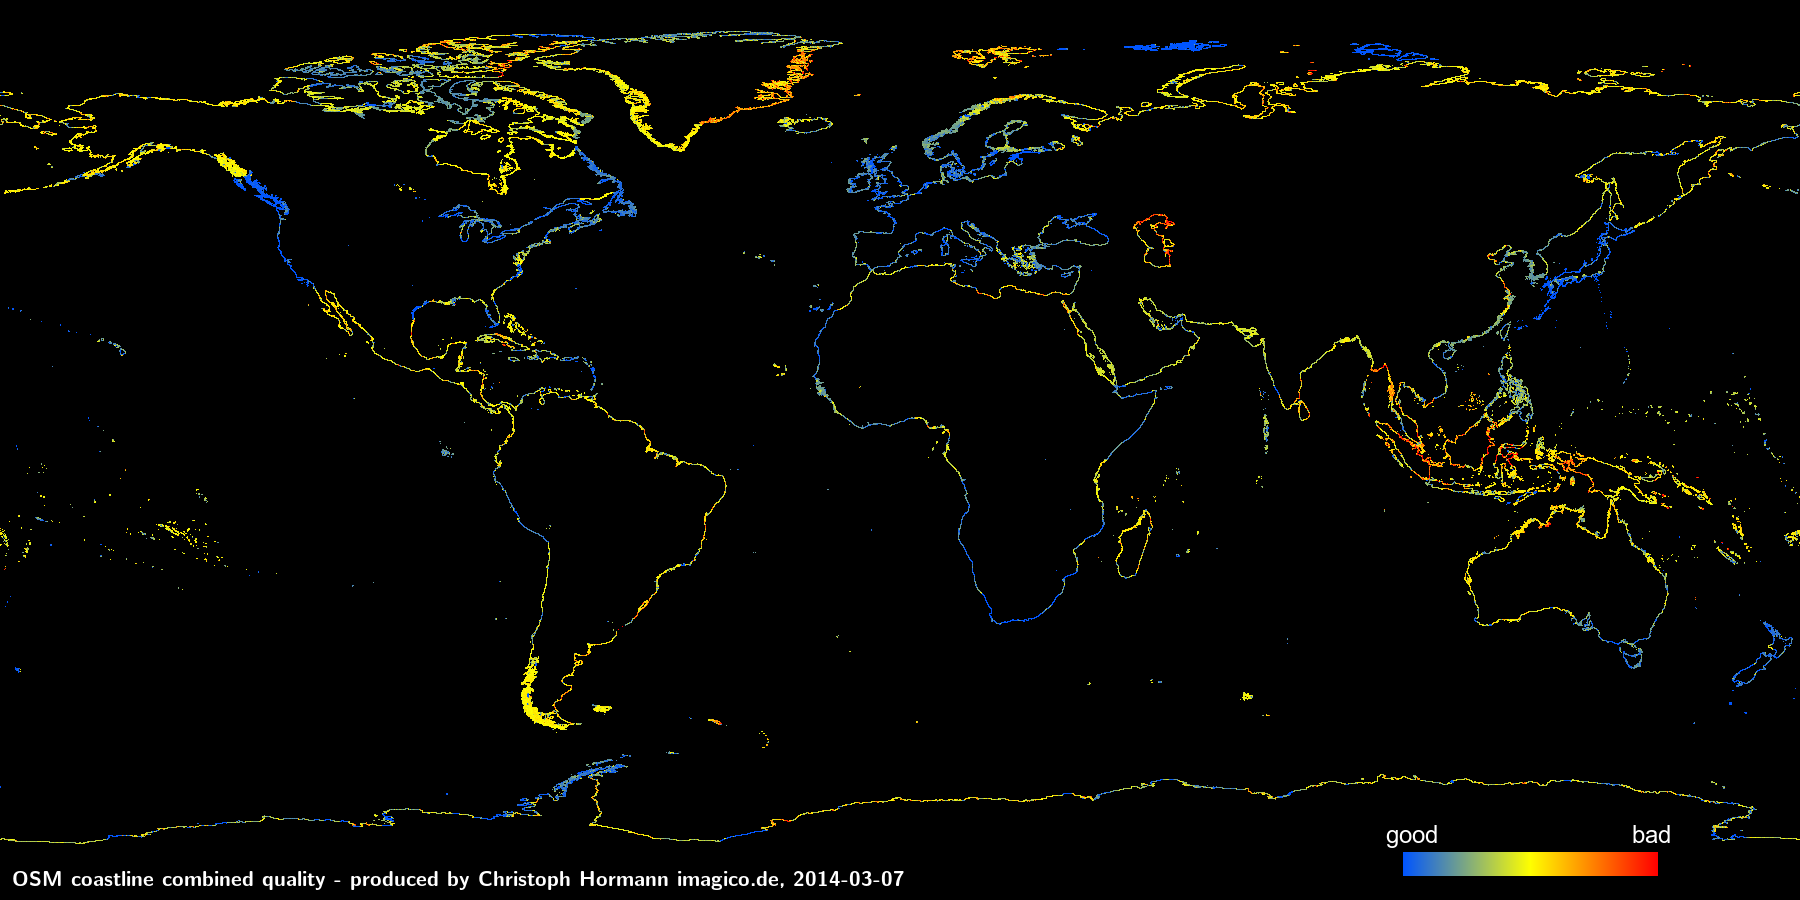
Updated quality analysis maps
Below are new version of the node distance, derivation angle and combined coastline quality maps. For detailed explanation see the initial coastline quality analysis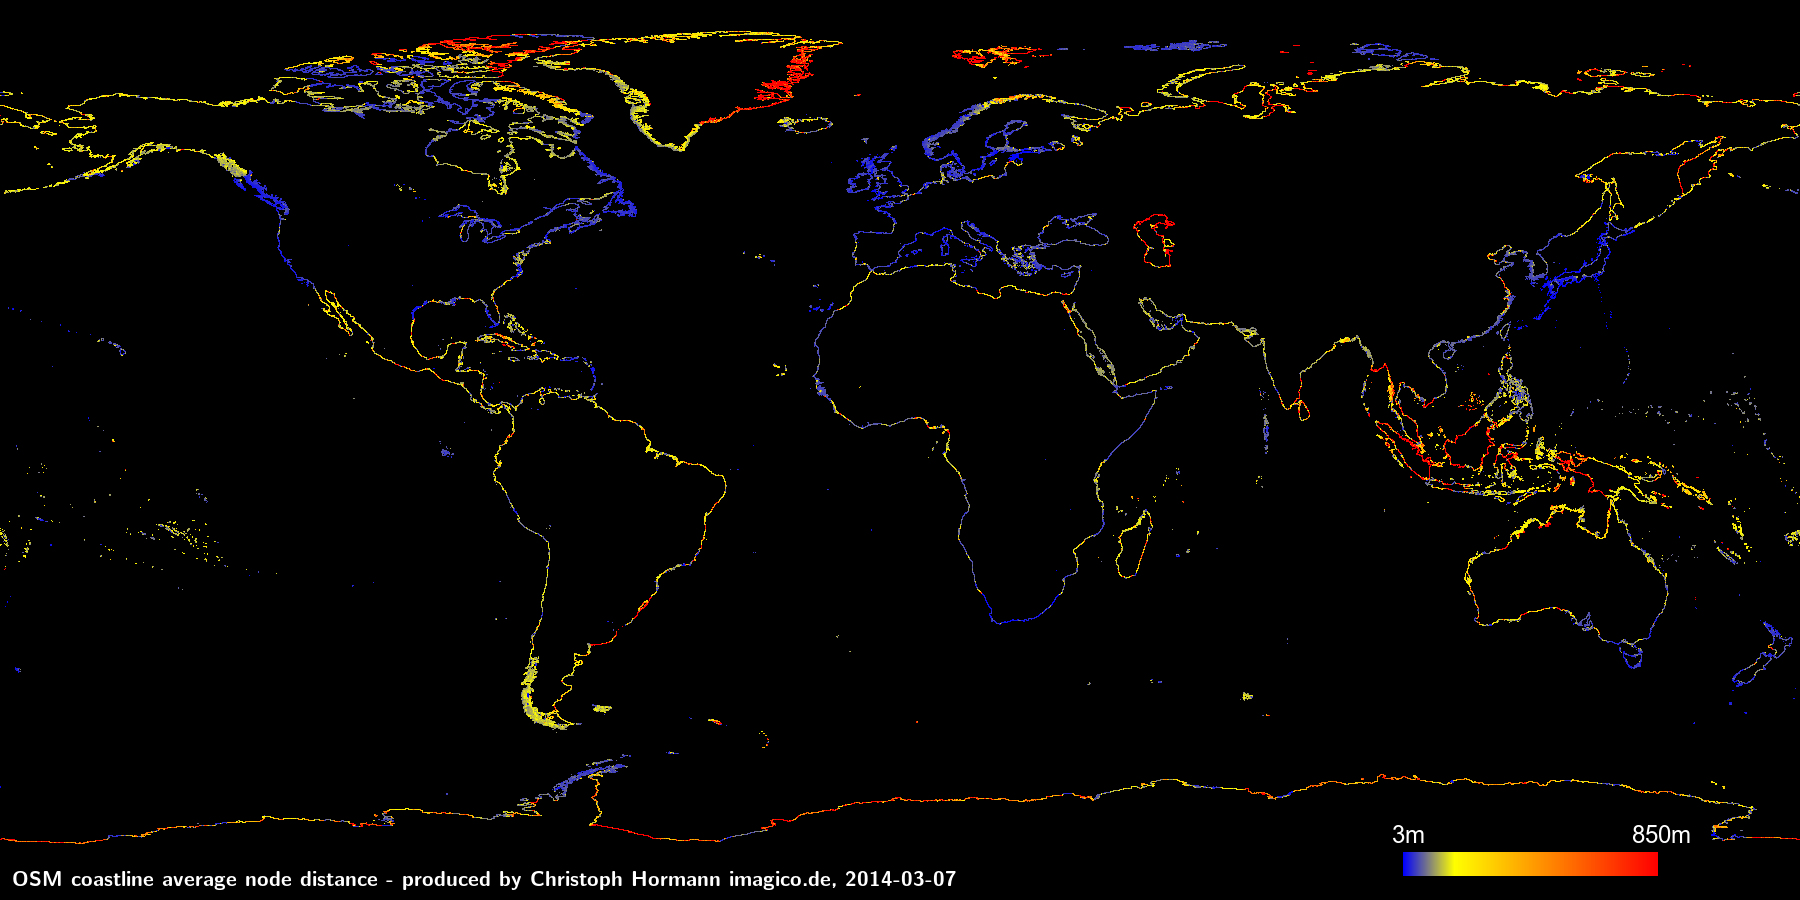

Christoph Hormann, March 2014

Visitor comments:
no comments yet.
By submitting your comment you agree to the privacy policy and agree to the information you provide (except for the email address) to be published on this website.